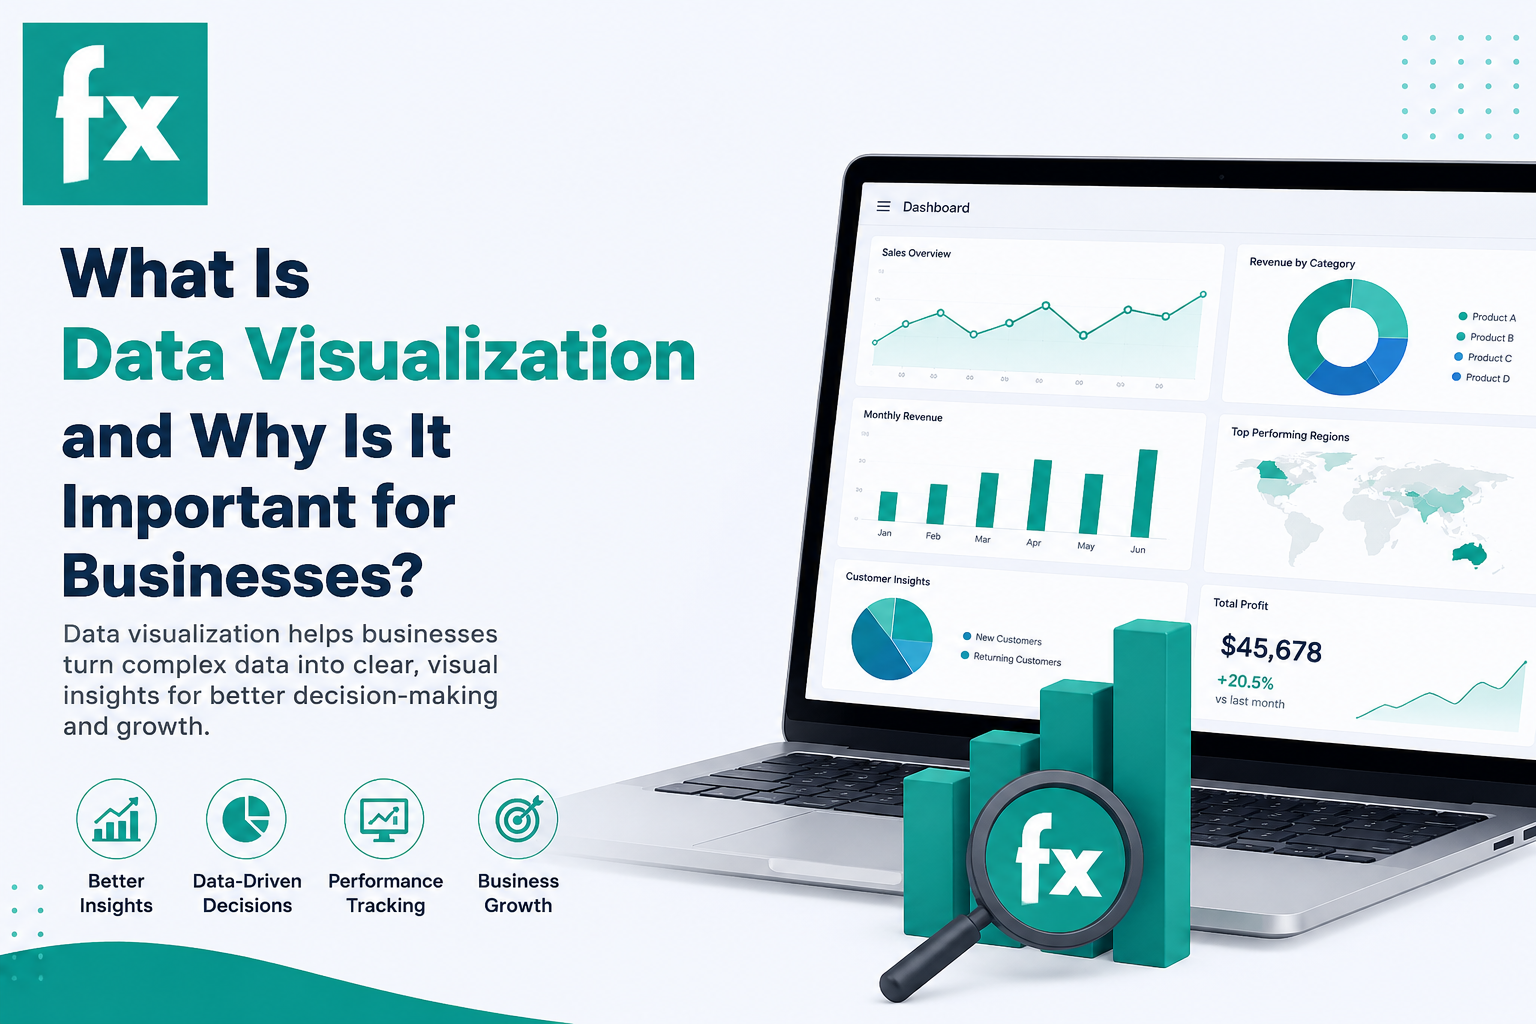
Data visualization is the process of presenting data and information through visual formats such as charts, graphs, dashboards, and interactive reports. It helps businesses transform complex datasets into easy-to-understand visual insights, making it easier to identify trends, patterns, and opportunities.
Businesses generate large amounts of data from sales, marketing, customer interactions, and operations. Without proper visualization, understanding this information can be challenging. Data visualization simplifies analysis by displaying information in a clear and organized manner, helping decision-makers make informed choices based on real-time data.
One of the key benefits of data visualization is improved decision-making. Visual reports allow organizations to quickly monitor performance, track key metrics, and identify areas that require attention. It also enhances communication by presenting data in a format that is easy for teams, stakeholders, and clients to understand.
Modern data visualization tools support interactive dashboards, automated reporting, and customized visual analytics, enabling businesses to gain deeper insights and improve operational efficiency. As data continues to grow in importance, effective data visualization has become an essential component of business intelligence and strategic planning.